Retrieval 1 - Building benchmarks and why keyword search still wins
I wanted to know what a small embedding model is worth for product search, once it has been fine-tuned on real shopping queries. Before any of that I needed a benchmark I could trust, and baselines that would mean something if I beat them.
This is the first of three posts. This one is the benchmark and the baselines. The second is the fine-tune. The third is the reranker on top.
Everything heavy ran on Modal. My laptop read a 51 MB judgements file, launched jobs and read the reports back. No model weights were loaded locally.
The dataset and its licence
The Shopping Queries Dataset (ESCI) was released by Amazon for the KDD Cup 2022, the competition at the Knowledge Discovery and Data Mining conference (Reddy et al., 2022, arXiv:2206.06588). It has real Amazon search queries. For each query, human annotators judged up to 40 products with one of four labels, which is where the name comes from.
| Label | Meaning | For the query "yeti coffee mug with handle" |
|---|---|---|
| E, Exact | Satisfies every part of the query | A YETI Rambler mug with a handle |
| S, Substitute | Fails one part, a customer might accept it | A Stanley mug with a handle, or a YETI mug without one |
| C, Complement | Goes with the asked-for product, is not it | A lid, or a set of YETI coasters |
| I, Irrelevant | None of the above | A YETI cooler |
The data is Apache-2.0 licensed, with a NOTICE reading "Copyright Amazon.com, Inc. or its affiliates". That lets me use, modify and redistribute it, commercially included, and it covers derived datasets like the training triples I built later. Three conditions - keep the licence and the NOTICE with any copy, state what was changed, and accept that it comes with no warranty. The authors ask that the paper be cited.
Two things the licence does not cover. The brand names and product descriptions stay their owners' content. And the data is a 2022 snapshot, not a live catalogue.
One thing cost me time at the start. The "small" and "large" versions are flags on the same file, not separate downloads. The small version is the harder competition subset, where the queries whose results were all Exact or trivially easy were filtered out.
I used the US locale and the small version. bge-base-en-v1.5 is English only, and so is BM25 with an English stemmer.
| Queries | Judgements | Distinct products | |
|---|---|---|---|
| All locales, large version | 130,652 | 2,621,288 | 1,802,772 |
| US, large | 97,345 | 1,818,825 | |
| US, small (used here) | 29,844 | 601,354 | 482,105 |
The label mix is the clearest sign that small means harder. Across all 2.6M judgements it is E 65.2%, S 21.9%, I 10.0%, C 2.9%. In the US small version it is E 43.5%, S 35.1%, I 16.9%, C 4.5%.
Queries are short - 3.5 words on average, 29 at most - and full of brands, model numbers and misspellings. A query has 20.1 judged products on average, median 16, and 8.8 Exact ones. One test query has no Exact product at all, so I dropped it.
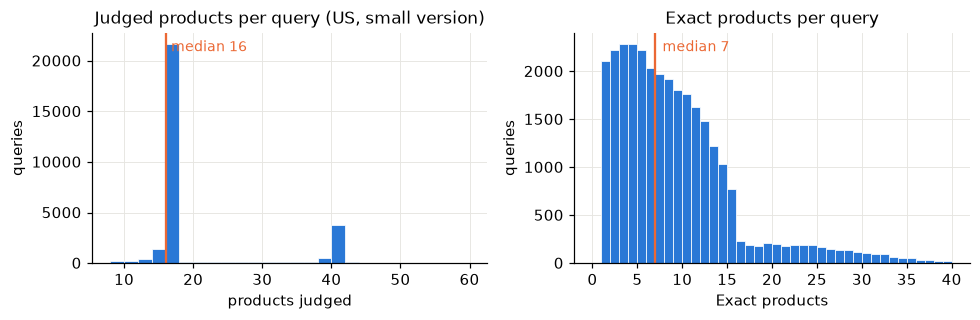
The jumps at 16 and 40 in the left panel are annotation budgets, not something about shopping.
Why the metric is recall@20
A production product search pipeline has two or three stages. Retrieval scores the query against every product in the catalogue, cheaply, and hands on a short list - 20 products here. Reranking is a cross-encoder that reads the query and each candidate together and re-orders those 20. Then the final list, which for a conversational shopping assistant is about 3 products passed into the Large Language Model (LLM) that writes the answer.
The reranker can only reorder what it is given. If the right product is not in the 20, nothing downstream gets it back. So stage 1 is judged on recall@k at the k it hands on - of the products a human marked Exact for this query, what share made it into the top 20.
Mean Reciprocal Rank (MRR) and normalized Discounted Cumulative Gain (nDCG) both reward getting first place right. That is the reranker's job, not stage 1's, so I report them as diagnostics and not as headlines.
| Metric | Definition on one query | Role here |
|---|---|---|
| recall@k | Share of the query's Exact products inside the top k | The stage-1 headline, k = 20 |
| hit@k | 1 if any Exact product is in the top k | The weakest useful guarantee: the reranker has one right answer to find |
| MRR@k | 1 / rank of the first Exact product, 0 if none | Diagnostic, rewards first place |
| nDCG@k | Gain / log₂(rank + 1) summed and normalised, gains E 1.0 / S 0.1 / C 0.01 / I 0 | The reranker's metric, gives substitutes partial credit |
A worked example. The real test query "yellow pepper" has 4 Exact products judged. A toy ranking with a Substitute at rank 1 and Exact products at ranks 2, 5 and 10 scores recall@5 0.5, recall@10 0.75, MRR 0.5, hit 1, nDCG@10 0.527. nDCG is below recall because the right answers are late, and the Substitute at rank 1 earns only 0.1.
The split, and what it cost
ESCI splits by query, so a test query never appears in training. But the products do. A fifth of the products judged for test queries also appear in some training query's list.
My concern was that a model could memorise "this product is what people mean by otterbox iphone 11" and score well without having learned anything that transfers. In a real catalogue the products change every day.
So I removed every product that appears in any test query's judged list from the training judgements. The cost is measurable. 34,756 of the 164,900 products in test lists, which is 21.1%, also appeared in training lists, and among test Exact products it is 20.7%. Removing them drops 66,945 of 419,653 training judgements, 16.0%, and 338 queries that lose all their Exact products. After the removal, zero test products appear in the training judgements.
| Queries | Judgements | Distinct products | Exact pairs | Exact per query | |
|---|---|---|---|---|---|
| Train, after removal, minus dev | 20,039 | 341,147 | 308,055 | 153,467 | 7.66 |
| Dev | 500 | 8,621 | 8,584 | 3,762 | 7.52 |
| Test, frozen | 8,955 | 181,686 | 164,887 | 79,708 | 8.90 |
A sixth of the training data, paid so the test set measures generalisation to new products. The dev set watches training and picks between runs. The test set is touched once per model, at the end.
The corpus is all 482,105 products, training products included. A retriever in production searches the whole catalogue, and the old products are exactly the near misses a fine-tuned model has to push down.
The passage the model reads is the product title, a Brand: …, Color: … line and the bullet points, cut at 1,200 characters. I left the description out of this version. It is long, often HTML, and mostly repeats the bullets.
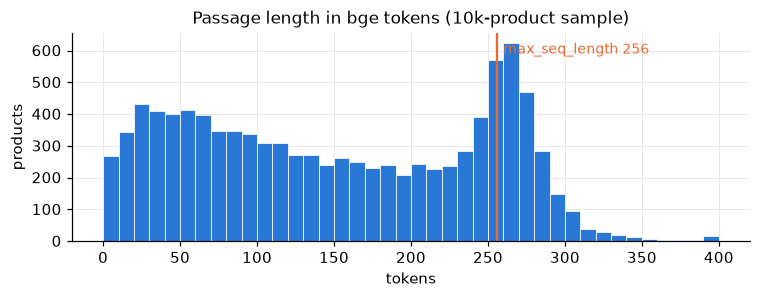
In tokens the passages are median 146, mean 152, and 19.6% are longer than the 256-token limit I used. So one passage in five is truncated. That is a known cost, not a surprise.
The baselines
Three retrievers, scored with the same evaluator on the same slice, plus a column for whether size beats domain.
Every configuration ran first on a smoke slice of 500 test queries over a 20,000-product corpus. That checks the pipeline end to end, and it measures encode throughput per model, which is what prices the full run before I launch it.
The smoke slice is a 24× smaller haystack, so its numbers come out much higher. It prices runs. It does not rank systems.
Here is the full benchmark, 8,955 product-disjoint test queries over 482,105 products. The hybrid row fuses BM25 with the dense model by Reciprocal Rank Fusion (RRF), which I come to below.
| System | Params | recall@10 | recall@20 | recall@50 | hit@20 | MRR@20 | nDCG@20 | Corpus encode |
|---|---|---|---|---|---|---|---|---|
| BM25, lexical, no model | 0 | 0.292 | 0.383 | 0.497 | 0.748 | 0.465 | 0.337 | 66 s, 8 CPU cores |
| bge-base-en-v1.5, off the shelf | 110M | 0.320 | 0.421 | 0.544 | 0.794 | 0.510 | 0.370 | 355 s, A10G |
| Hybrid: BM25 + bge-base, RRF | – | 0.331 | 0.437 | 0.570 | 0.803 | 0.525 | 0.385 | – |
| bge-large-en-v1.5, off the shelf | 335M | 0.332 | 0.436 | 0.563 | 0.801 | 0.520 | 0.384 | 1,136 s, A10G |
| Qwen3-Embedding-0.6B | 0.6B | 0.280 | 0.376 | 0.502 | 0.761 | 0.467 | 0.332 | 1,288 s, L40S |
| Qwen3-Embedding-8B | 7.6B | 0.341 | 0.455 | 0.595 | 0.817 | 0.532 | 0.401 | 8,979 s, L40S |
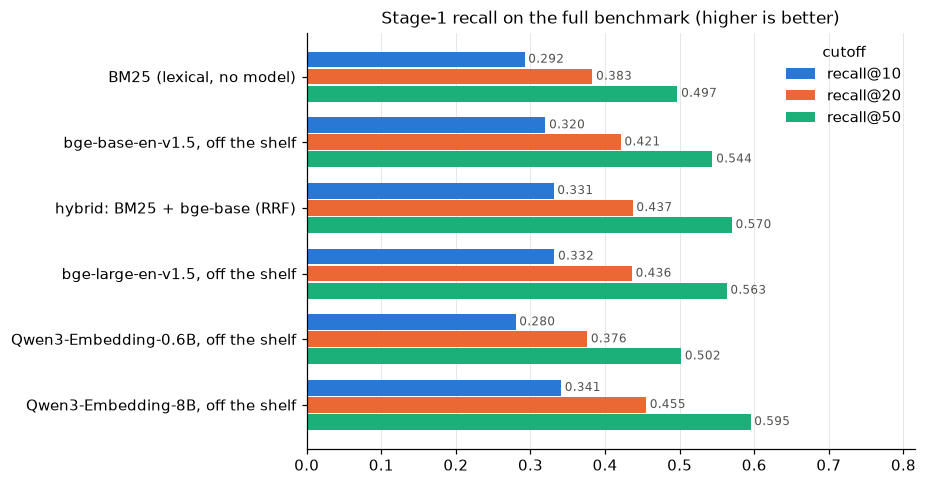
Four things stood out.
BM25 is a serious opponent on shopping queries. It is the term weighting formula behind classic search engines - a document scores high when it contains the query's words, rare words count more, long documents are normalised down. No model, no training, 66 seconds on eight CPU cores against 355 seconds on a GPU. And it reaches 0.383 against the dense model's 0.421.
Per query it is not a uniform loss either. On recall@20 the dense model beats BM25 on 34.2% of queries, BM25 beats the dense model on 24.0%, and they tie on 41.8%. The split makes sense. BM25 wins outright where a rare word carries the whole query - "aeramax 290 small room", "aga stove", "11.5 x 8 clear plastic bux". The dense model wins on paraphrase and intent - "8 month old towels", "49ers gym apparel", "4 inch non marking caster wheel".
Hybrid search matched a model three times the size. RRF combines two rankings by rank rather than by score, so BM25's scores and the dense model's cosines never have to be put on one scale.
def rrf(rankings, k=60, depth=100):
    """score(p) = Σ_systems 1 / (k + rank_system(p))."""
    fused = {}
    for qid in set().union(*(r.keys() for r in rankings)):
        score = defaultdict(float)
        for r in rankings:
            for i, p in enumerate(r.get(qid, [])[:depth]):
                score[p] += 1.0 / (k + i + 1)
        fused[qid] = [p for p, _ in sorted(score.items(), key=lambda kv: -kv[1])[:depth]]
    return fused
Fusing BM25 with bge-base gives 0.437 recall@20. That is above both parts, and level with bge-large at 0.436 for a third of the encode time. A paired bootstrap over the test queries says this particular comparison is a tie - +0.001, with a 95% interval of −0.003 to +0.005, hybrid ahead in 70% of resamples. So free rank fusion of a 110M model with a lexical index reaches the same place as tripling the parameter count. It is not better than it.
Fusion is also blunt. It beats both its parts on only 11.5% of queries, and it is worse than the better part on 28.5%. RRF averages ranks, so when one retriever is right and the other is lost, the right one gets diluted. That is the argument for a reranker over the union rather than a fixed fusion rule.
A 600M embedding model lost to BM25. Qwen3-Embedding-0.6B, with a shopping-specific instruction on the query side, scores 0.376 recall@20. That is below BM25's 0.383 and below the 110M bge-base's 0.421, and the bootstrap puts BM25 ahead of it in 98.4% of resamples. Its leaderboard rank on the Massive Text Embedding Benchmark did not transfer to a 482k-product shopping catalogue. The 8B model from the same family is the best off-the-shelf system in the table, so this is not a family problem. The only size curve that matters is the one measured on your own corpus.
Qwen3-Embedding-8B is the best off-the-shelf model, and size buys little before it. bge-large is three times the parameters and 3.2 times the encode time for +0.015 recall@20. The 8B model is +0.034 over bge-base, for 25 times the encode time - 2.5 hours on an L40S for one pass over the catalogue - and a 4,096-float vector per product instead of 768.
So that is the bar. 0.421 is where a 110M model starts, 0.455 is the best money can buy off the shelf, and 0.437 is what hybrid fusion gives for free.
Two more things I would keep in mind. The haystack dominates everything - from the 20k smoke slice to the 482k corpus, bge-base falls from 0.717 to 0.421 recall@20, and every system loses 0.28 to 0.31. And 14.1% of test queries get no Exact product into anyone's top 20. Those are the annotation gaps and the genuinely hard queries, and fine-tuning cannot help them.
What it cost
Costs are container time times list price. The Modal dashboard invoice is the authority.
| Job | Container | Hardware | Estimated cost |
|---|---|---|---|
| Data build: download 1.1 GB, slice, write benchmark | 59 s | 4 CPU cores, 16 GB | $0.005 |
| Smoke runs, including one that failed on download | 29 s; 465 s; 5 s; 106 s | A10G; L40S; CPU; A10G | $0.29 |
| Full: bge-base + bge-large | 1,516 s | A10G | $0.46 |
| Full: BM25 + hybrid | 95 s | 8 CPU cores | $0.02 |
| Full: Qwen3-Embedding 0.6B + 8B | 10,329 s | L40S | $5.60 |
| Total | about $6.40 |
I priced the 8B run at $4.94 plus $0.71 from the smoke throughput and it came in at $5.60. The per-product encode speed held, 18.6 against 18.9 seconds per 1,000 products, which is the point of pricing from a smoke slice. Loading evaluation models in half precision made bge-base 4.7 times faster per product, from 3.5 to 0.7 seconds per 1,000.
The $0.03 line for a first smoke attempt that failed on download is in the table on purpose. Failed runs are part of the bill.
Three quarters of the total is one model's single pass over the catalogue. That number also decides whether you can iterate, because any fine-tune invalidates every stored product vector and the re-encode comes round again.
What this sets up
The table above is the bar, and the harness is fixed - the same 8,955 test queries, the same 482,105-product corpus, rankings to depth 100 in the same format, so the hybrid and the reranker can be built on any of them.
The next post fine-tunes the 110M model against that bar. The question I wanted answered was which negatives teach it anything.